Motivation
There was always this thing where, whenever a box plot appeared, I would just move on thinking, “What is that?” So let’s break it down this time! I used to wonder what Q1 and Q2 were, but thanks to the GOAT-level explanation from Khan Academy below, I was able to understand it.
What Is the Interquartile Range (IQR) & How to Interpret a Box Plot
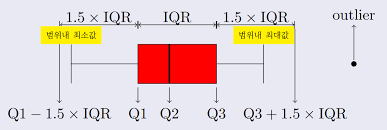
- First, find the median of the data.
- Find the median of each of [minimum | median] | [median | maximum].
- Q1 and Q3 are the range of the medians of the ranges [minimum | median] | [median | maximum] from step 2.
- The interquartile range is the difference between the medians of the two groups divided based on the median. -> In other words, at least 50% of the data values are distributed between Q1 and Q3.
- The whiskers on both sides of the box are the maximum values of the data.
**Median: ** The median is not the average; it is the value located in the middle of the number of data points. If the number of data points is even, the median is the average of the two middle numbers.
Outliers (What Is an Outliar?)
- In a box plot, they are the values outside the whiskers, i.e., outside (Q1 - 1.5 * IQR) or (Q3 + 1.5 * IQR).
- When measuring a person’s movements with something like an Apple Watch, outliers can be removed or utilized.
- GOAT Reference: https://ko.khanacademy.org/math/statistics-probability/summarizing-quantitative-data/interquartile-range-iqr/a/range-and-interquartile-range-worksheet
- Application examples: 2-1. https://hsm-edu.tistory.com/1542 2-2 Python. https://aliencoder.tistory.com/36