Classification
Classification이란?
주어진 입력 값이 어떤 클래스에 속할지에 대한 결괏값을 도출하는 AI
모델종류
- 트리 구조 기반
- DecisionTree
- RandomForest
- …
- 확률 모델 기반
- 나이브 베이즈 분류기…
- 결정 경계 기반
- 선형 분류기
- 로지스틱 회귀 분류기
- SVM -…
- 신경망
- 퍼셉트론
- 딥러닝모델…
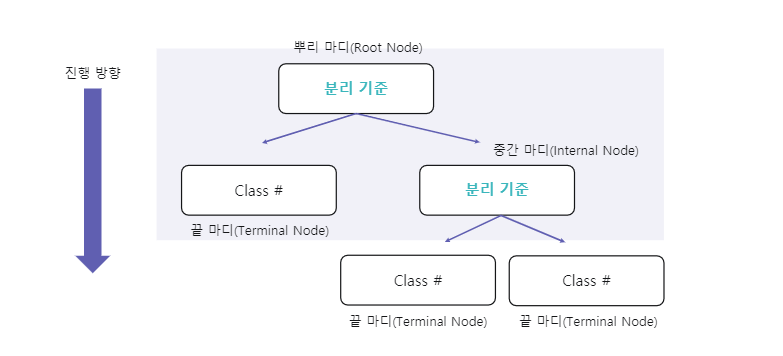
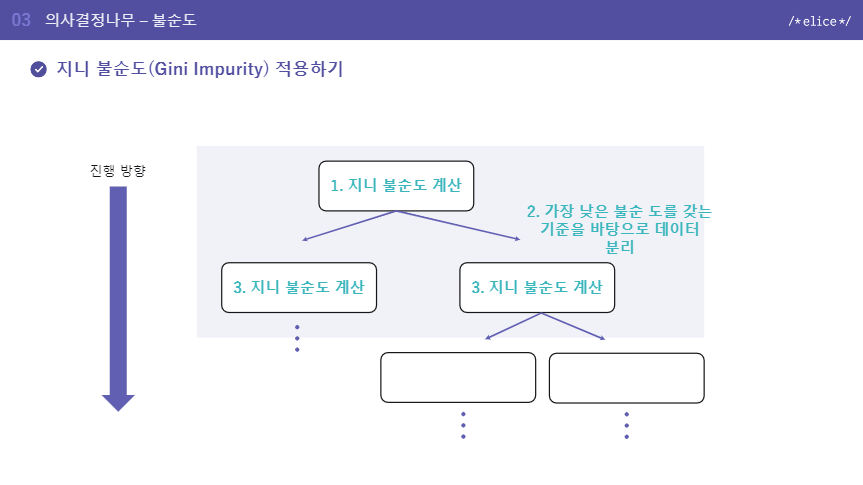
Decision Tree model structure
DecisionTree란?
- 특정 질문을 통해서 정답을 찾아가는 모델 (최상단의 뿌리 마디에서 마지막 끝마디까지 아래방향으로 진행)
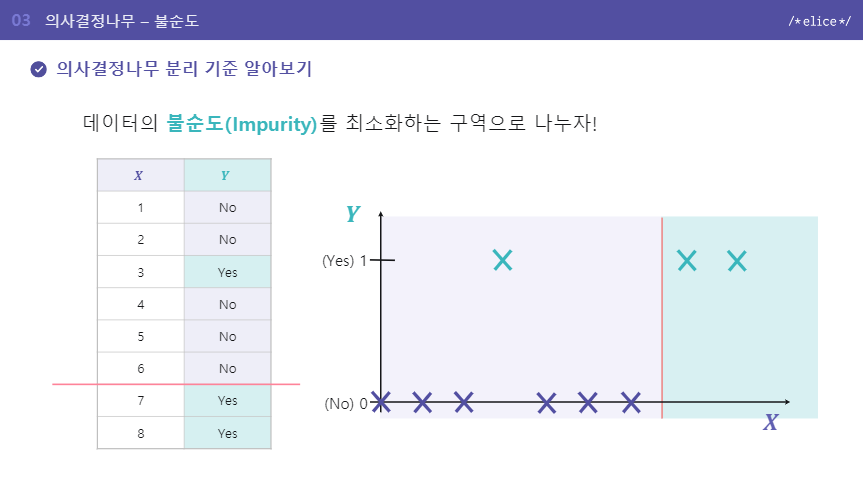
Impurity(불순도)
불순도란?
- 다른 데이터가 섞여 있는 정도
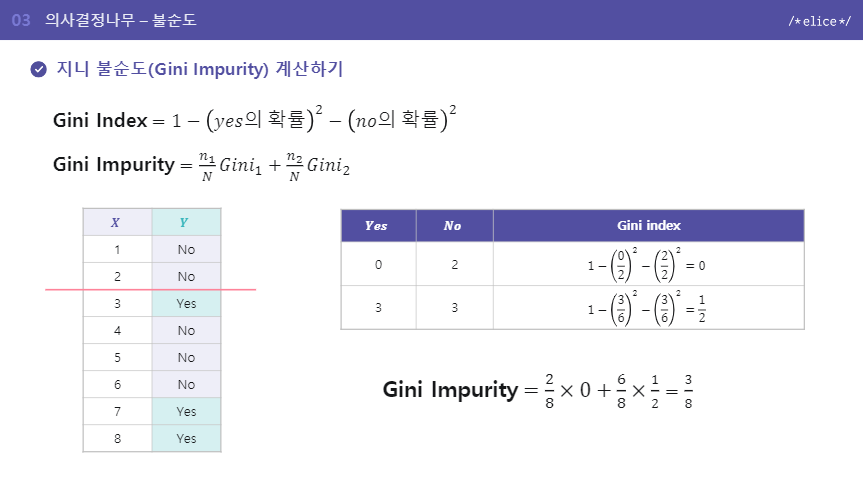
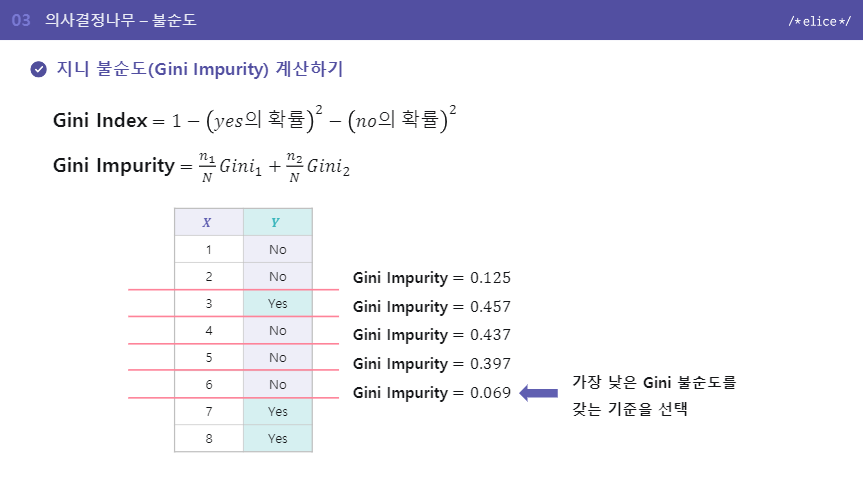
Impurity 측정 방법 - Gini Impurity
지니 계수(Gini Index) 해당 구역 안에 특정 클래스에 속하는 데이터의 비율을 모두 제외한 값, 다양성을 계산하는 방법
지니 불순도 예제를 보고 참고해보자
DecsionTree depth의 trade-off
- 깊이가 깊어질수록 세분화해서 나눌수 있다.
- 너무 깊은 모델 -> Overfitting -> 지양
cf) overfitting
- 학습데이터에 대해서 너무 세밀하게 예측하면 test set에 대한 성능이 떨어질 수 있음. -> 데이터를 여기에 선을 그어 분류해봤더니 다른 데이터 셋에 대해서는 전혀 다른 지점에 선을 그어야 더 정확도가 높았던 것임.
DTmodel = DecisionTreeClassifier(max_depth=5)
DTmodel.fit(train_X, train_Y)
# max depth를 하이퍼파라미터튜닝할때는 오버피팅이되는가를 따로 체크해봐야함.
DecisionTree특징
- 결과가 직관적, 해석 쉬움
- depth가 깊어질수록 overfitting 문제
- 트리 작업속도 매우 빠름
Logistic Regression
Logistic Regression이란?
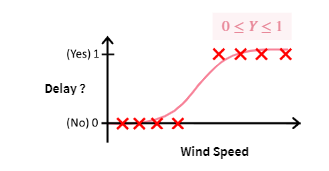
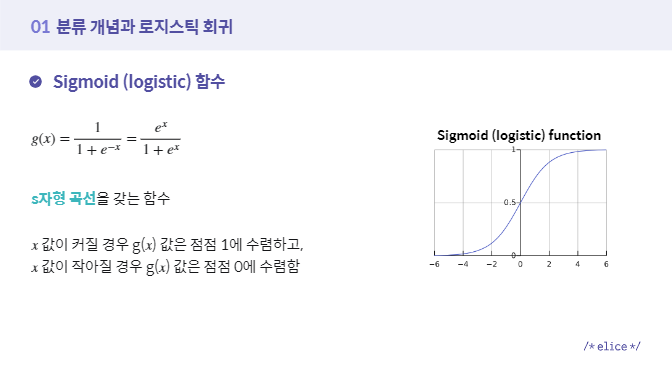
Binary Classification problem을 해결하기 위한 model이다. 최소값 0, 최대값 1로 결과값을 수렴시키기 위해 sigmoid(logistic) 함수 사용한다.
cf) sigmoid함수
- 함수 종류중 하나로 s자형 곡선
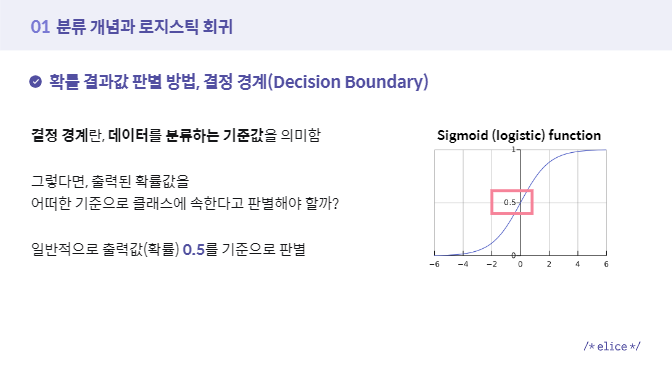
cf2) Decision Boundary
- 데이터를 분류하는 기준값
Logistic Regression 왜 사용?
일반적은 Regression algorithm은 classification problem에 그대로 사용할 수 없기 때문에 해당 class에 속할 확률인 0 또는 1사이의 값만 내보낼 수 있도록 Linear Regression을 수정한다.
Logistic Regression 특징
- Binary classification을 위해 사용
- Linear Regression의 특징 보유
Support Vector Machine(SVM)
- Decision Boundary, 즉 데이터 분류하는 기준선을 정의하는 모델
-> 문제 정의: 양성과 음성 두개의 결과 값으로 분류되는 Binary Classification Problem
ex) 지연 여부 판별, 이상 거래 판별
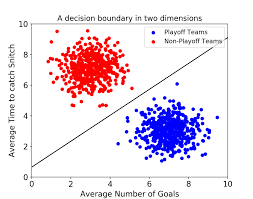
최적의 Decision Boundary
- 데이터 군집으로부터 최대한 멀리 떨어지는 것
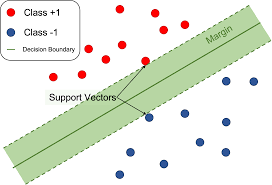
Support Vector란?
- Decision Boundary에 가장 가까이 있는 data point들
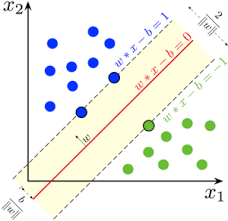
Margin
- Decision Boundary와 support vector 사이의 거리
- margin을 최대화하는 쪽으로 Decision Boundary를 그림
- Outlier 허용범위에 따라 hard margin과 soft margin으로 구분됨
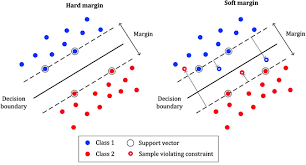
svm 특징
- 선형 분류와 비선형 분류 모두 가능
- 고차원 데이터에서도 높은 성능의 결과 도출
- 회귀에도 적용가능
Naive Bayes Classification
- 각 특징들이 서로 영향을 미치지 않을 것이라는 독립적이라는 가정을 설정하고 베이즈 정리를 통한 확률 통계학적 분류 알고리즘
- 응용: 스팸 메일과 정상 메일 분류, 텍스트 분류, 감정 분석, 추천 시스템
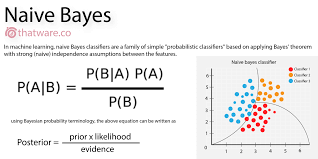
cf) 베이즈 정리란?
- 데이터라는 조건이 주어졌을 때의 조건부확률을 구하는 공식임
예시-스팸 메일
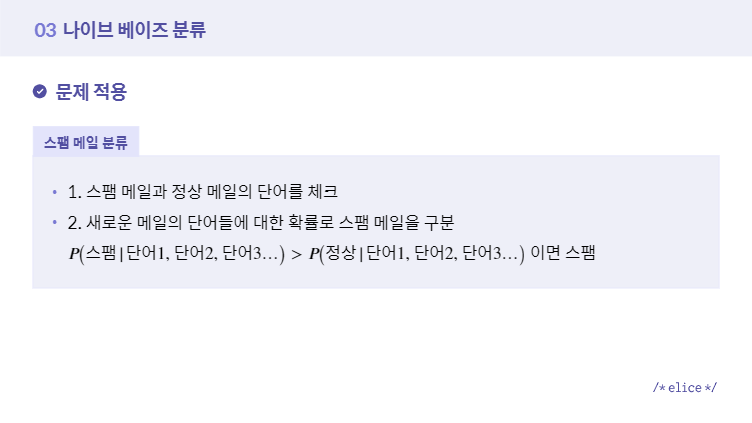
구현
- 코드에 각 확률을 구하고, 나이브 베이즈 정리로 구현함.
- sklearn 나이브 베이즈 라이브러리사용
1. 각각 구하기
import numpy as np

"""
1. "확인" 이라는 키워드가 등장했을 때
    해당 메일이 스팸 메일인지 정상 메일인지
    판별하기 위한 함수를 구현합니다.
"""
def bayes_theorem():
    # 1. P(“스팸 메일”) 의 확률을 구하세요.
    p_spam = float(8/20)

    # 2. P(“확인” | “스팸 메일”) 의 확률을 구하세요.
    p_confirm_spam = float(5/8)

    # 3. P(“정상 메일”) 의 확률을 구하세요.
    p_ham = float(12/20)

    # 4. P(“확인” | "정상 메일" ) 의 확률을 구하세요.
    p_confirm_ham = float(2/12)

    # 5. P( "스팸 메일" | "확인" ) 의 확률을 구하세요.
    p_spam_confirm = float(5/7)

    # 6. P( "정상 메일" | "확인" ) 의 확률을 구하세요.
    p_ham_confirm = float(2/7)

    return p_spam_confirm, p_ham_confirm

def main():

    p_spam_confirm, p_ham_confirm = bayes_theorem()

    print("P(spam|confirm) = ",p_spam_confirm, "\nP(ham|confirm) = ",p_ham_confirm, "\n")

    # 두 값을 비교하여 확인 키워드가 스팸에 가까운지 정상 메일에 가까운지 확인합니다.
    value = [p_spam_confirm, p_ham_confirm]

    if p_spam_confirm > p_ham_confirm:
        print( round(value[0] * 100, 2), "% 의 확률로 스팸 메일에 가깝습니다.")
    else :
        print( round(value[1] * 100, 2), "% 의 확률로 일반 메일에 가깝습니다.")


if __name__ == "__main__":
    main()
2. 라이브러리 활용
from sklearn.datasets import load_wine

from sklearn.model_selection import train_test_split
from sklearn.naive_bayes import GaussianNB
from sklearn.metrics import accuracy_score

"""
1. 데이터를 불러오고,
   불러온 데이터를 학습용, 테스트용 데이터로
   분리하여 반환하는 함수를 구현합니다.

   Step01. 사이킷런에 저장되어 있는 데이터를
           (X, y) 형태로 불러옵니다.

   Step02. 불러온 데이터를
           학습용 데이터와 테스트용 데이터로 분리합니다.

           학습용 데이터 : 80%, 테스트용 데이터 : 20%,

           일관된 결과 확인을 위해 random_state를
           0 으로 설정합니다.
"""
def load_data():

    X, y = load_wine(return_X_y = True)

    print("데이터 확인해보기 :\n", X[:1])

    train_X, test_X, train_y, test_y = train_test_split(X,y, test_size=0.20, random_state = 0)

    return train_X, test_X, train_y, test_y

"""
2. 가우시안 나이브 베이즈 모델을 불러오고,
   학습을 진행한 후 테스트 데이터에 대한
   예측값을 반환하는 함수를 구현합니다.

   Step01. 가우시안 나이브 베이즈 모델을 정의합니다.

   Step02. 학습용 데이터에 대해 모델을 학습시킵니다.

   Step03. 테스트 데이터에 대한 모델 예측을 수행합니다.
"""
def Gaussian_NB(train_X, test_X, train_y, test_y):

    model = GaussianNB()

    model.fit(train_X,train_y)

    predicted = model.predict(test_X)

    return predicted

# 데이터 불러오기, 모델 예측 결과를 확인할 수 있는 함수입니다.
def main():

    train_X, test_X, train_y, test_y = load_data()

    predicted = Gaussian_NB(train_X, test_X, train_y, test_y)

    ## 모델 정확도를 통해 분류 성능을 확인해봅니다.
    print("\nModel Accuracy : ")
    print(accuracy_score(test_y, predicted))

if __name__ == "__main__":
    main()
코드출처: 2022 군 장병 swai역량 강화 중급 프로젝트 과정
특징
- 각 특징들이 독립이라면 다른 분류 방식에 비해 결과가 좋고, 학습 데이터도 적게 필요
- 각 특징들이 독립이 아니고 서로 영향을 미치면 분류 결과 신뢰성 하락
- 학습 데이터에 없는 범주의 데이터일 경우 정상적 예측 불가능
KNN(K-Nearest Neighbor)
- 기존 데이터 가운데 가장 가까운 k개의 이웃 정보로 부터 새로운 데이터를 예측
- ex) 고객이 평가한 영화 평점 데이터를 기준으로 기존 보유 고객을 분류, 새로 유입된 고객을 기준에 따라 분류하고자 함
원리
- 설정된 k값에 따라 가까운 거리 내의 이웃 수에 따라 분류
- 새로운 고객 데이터가 들어왔을때 k의 값에 따라 클래스가 달라짐.
특징
- 직관적, 복잡x, 결과 해석 굿
- k값에 결정에 따라 성능 좌우
- 학습이 크게 필요 없는 lazy model
cf) knn과 kmeans 는 classification과 clustering이라는 목적에서 차이가 있다. 보충설명 링크: https://velog.io/@jhlee508/%EB%A8%B8%EC%8B%A0%EB%9F%AC%EB%8B%9D-K-%ED%8F%89%EA%B7%A0K-Means-%EC%95%8C%EA%B3%A0%EB%A6%AC%EC%A6%98
평가지표
종류
- Confusion matrix
- Accuracy
- Precision
- Recall
Confusion matrix
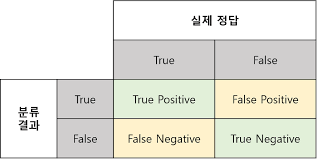
True Positive: 실제 Positive인 값을 Positive라고 예측(정답) True Negative: 실제 Negative인 값을 Negative라고 예측(정답)
False Positive: 실제 Negative인 값을 Positive라고 예측(오답) - 1형 오류 False Negative: 실제 Positive인 값을 Negative라고 예측(오답) - 2형 오류
Accuracy
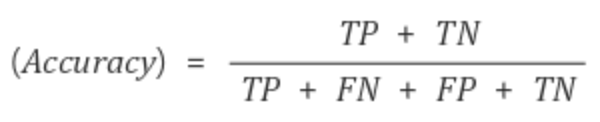
- 전체 데이터 중에서 제대로 분류된 데이터의 비율
- 일반적으로 classification에서 주요 평가 방법으로 사용
- 클래스의 비율이 불균형 할 경우 평가지표의 신뢰성을 잃을 수 있음
- 용도: 모델이 얼마나 정확하게 분류했는가?
Precision & Recall
#### Precision
- 모델이 positive라고 분류한 데이터 중에서 실제로 positive인 데이터 비율 - 용도: Negative가 중요한 경우 (실제로 Negative인 데이터를 Positive라고 판단하면 안되는 경우 사용!)
- ex) 스팸메일 classification -> 일반 메일을 스팸 메일(Positive)로 잘못 예측하면 중요한 메일을 전달받지 못할수도 있음.
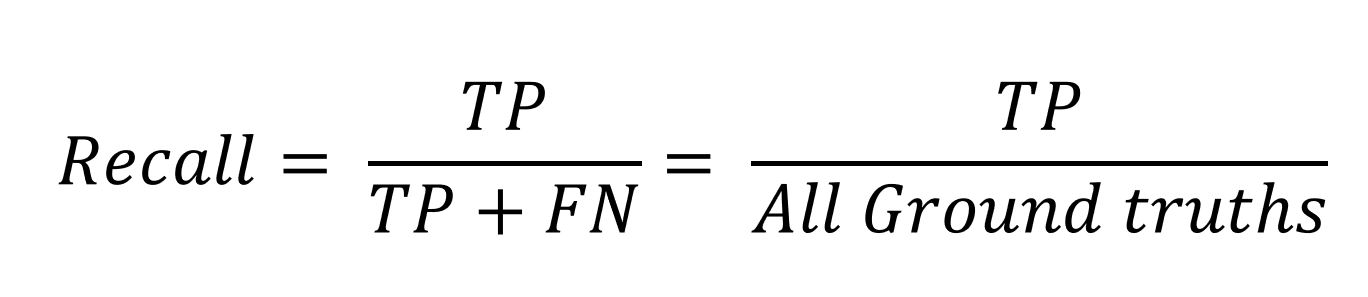
Recall/TPR

- 실제로 positive인 데이터 중에서 모델이 positive로 분류한 데이터의 비율 - 용도: Positive가 중요한 경우 (실제로 Positive가 데이터를 Negative라고 판단하면 안되는 경우 사용!)
- ex) 악성종양(Positive)을 양성종양(Negative)으로 잘못 예측했을 경우 제 때 치료를 받지 못하게 되어 생명이 위급해질 수 있음.
출처 1)첫번째 decision tree 구조 사진: 2022 군장병 sw/ai 역량 강화 프로그램 분류 단원 https://military22.elice.io/courses/26526/lectures/204994/materials/12 2)내용참조:2022 군장병 sw/ai 역량 강화 프로그램 분류 단원 3)Confusion matrix 사진 : https://eunsukimme.github.io/ml/2019/10/21/Accuracy-Recall-Precision-F1-score/ 4)Accuracy 수식 사진:https://wooono.tistory.com/232 5)precision 수식: https://ctkim.tistory.com/79 6)recall 수식: http://www.gisdeveloper.co.kr/?p=8146 7)꼬지모 사진출처:https://pokemon.fandom.com/ko/wiki/%EA%BC%AC%EC%A7%80%EB%AA%A8_(%ED%8F%AC%EC%BC%93%EB%AA%AC) 8)SVM 모델 사진 https://hleecaster.com/ml-svm-concept/ 9)Logistic Regression 모델 설명 사진들: 2022 군장병 sw/ai 역량 강화 프로그램 분류 단원 https://military22.elice.io/courses/26528/lectures/204997/materials/13 10)Support Vector 사진: https://sjpyo.tistory.com/m/40 11)hard/soft margin: https://ankitnitjsr13.medium.com/math-behind-svm-support-vector-machine-864e58977fdb